 |
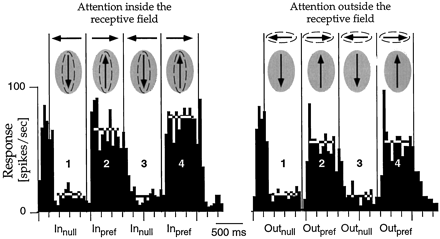
| Figure 7. Example response of a single neuron in area MST. |
AI = (rIn_pref - rOut_pref) / (rIn_pref + rOut_pref)
where, rIn_pref and rOut_pref are the neuron firing
rate when the stimulus is moving in the preferred direction in and out
of the receptive field respectively (each portion of a trial when the neuron
is moving in one direction is referred to as an "epoch"). Furthermore,
the ratio rIn_pref / rOut_pref was used to measure
the average neuron firing rate when monkey was attending to the stimulus
inside the receptive field
Figure 7 illustrates an example response of a single neuron in area
MST while the subject attended to the dot (stimulus) inside the receptive
field (plot on the left) and outside the receptive field (plot on the right)
during four trial epochs.
 |
| Figure 7. Example response of a single neuron in area MST. |
For this cell, the preferred direction of motion was in the upward direction
and as shown in the plots, in this situation, the response of the cell
was greater. Figure 8 illustrates the AI distribution for all neurons
when the motion was in the preferred direction (the vertically oriented
black arrows in the shaded region indicate the stimulus' direction of motion).
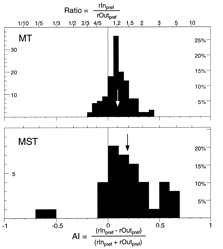 |
| Figure 8. Attentional Index (AI) distribution for all neurons examined in experiment one, when the stimulus was moving the preferred direction |
The top histogram illustrates the average firing rate from 137 preferred
direction epochs of 66 MT cells. The mean rate of neuron firing was
0.10 (e.g. approximately a 20% enhancement when the stimulus was moving
in the preferred direction). The bottom histogram illustrates the
Attentional Index for 39 preferred direction of motion epochs for 21 MT
cells. The mean AI was 0.19 (e.g. approximately a 40% enhancement).
Finally, figure 9 illustrates a scatter plot of the individual mean neuron
firing rates.
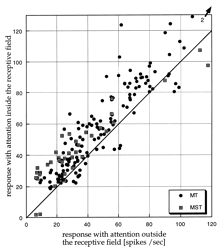 |
| Figure 9. Scatter plot of the individual mean firing rates for the neurons examined in experiment one. |
In the scatter plot of figure 9, the x-axis represents attention directed to the anti-preferred motion while the y-axis represents attention directed to preferred motion. The diagonal line represents the response when the firing rate is the same for both preferred and anti-preferred directions of motion, while points above diagonal line indicate stronger response to preferred direction
 |
| Figure 10. Example response of the firing of one cell. |
As the example illustrates, the response is greatest when attention was directed to one dot in the receptive field moving in the preferred direction (epochs one and three in the left-most plot). When the subjects attended to either dot in receptive field, neuronal response was strongest when the dot moved in the preferred direction. When the subject attended to the "other" dot in the receptive field, (which was moving in the anti-preferred direction), neuronal response "flipped" and was once again strongest when the dot's direction changed (e.g. epochs two and four of the middle plot). To further clarify this, consider the left-most plot. As shown by the firing rate in epochs one and three, the preferred direction of motion is upwards, while the anti-preferred direction of motion is downwards (epochs two and four). However, as shown in epochs two and four of the middle plot, the dot moving in the anti-preferred direction switched directions to the preferred direction (it switched from moving downwards to moving upwards). Hence the increased firing in epochs two and four. Similarly, the dot moving in the preferred direction switched its direction of motion to the anti-preferred direction and therefore, the low firing rate in epochs one and three of the middle plot.
When attending to the stimulus outside the receptive field, neuronal response maintained a steady level of activity. In this case, The response was weaker than when attending to a neuron in the receptive field moving in the preferred direction. However, the response was stronger than when attending to the stimulus in the receptive field moving in anti-preferred direction.
Figures 11 below illustrates the distribution of AI values for the neurons
examined in experiment two.
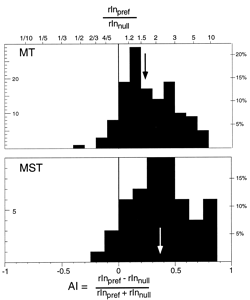 |
| Figure 11. Attentional Index (AI) distribution for all neurons examined in experiment one, when the stimulus was moving the preferred direction. |
The top histogram illustrates the values of rIn_pref / rOut_pref for 134 epoch of 46 neurons in area MT. The mean value was 0.24 corresponding to an increase of approximately 70%. The bottom histogram illustrates the AI values of 53 epochs from 16 neurons in area MST. The mean AI value was 0.33 corresponding to approximately a 100% enhancement.
Finally, figure 12 below illustrates the scatter plot of the individual
mean firing rates. The x,y axis and the diagonal line have the same
meaning as the scatter plot of experiment one.
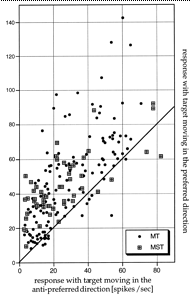 |
| Figure 12. Scatter plot of the individual mean firing rates for the neurons examined in experiment two. |