Fitting Linear Data 1
Many models of physical phenomenon are linear, or approximately
linear:
- F = ma (Newton's second law of motion)
- pV = nRT (ideal gas law)
- F = -kx (Hooke's law)
- ΔV / V = α Δ T (thermal expansion)
Fitting Linear Data 2
One problem we face when trying to fit a model to the
measurements is that physical measurements have limited precision;
there will always be some deviation between the model and the
measurements.
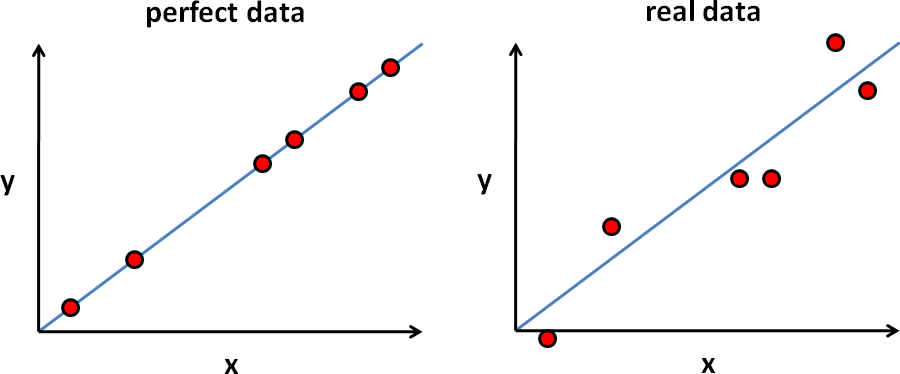
How do we fit a line to imperfect (noisy) data?
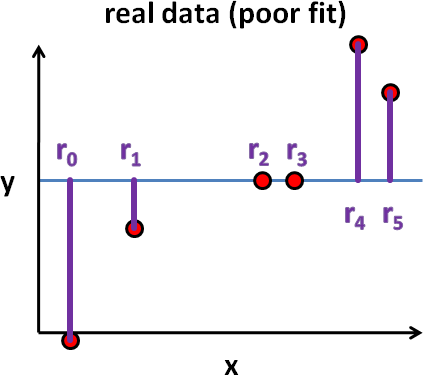
Residual Errors
 Suppose we fit some line to the data and calculated the
vertical difference between the line and each data point. For
perfect data, these differences would all be zero. For real
data, these differences are not zero, and are a measure of
the goodness-of-fit between the line and data points.
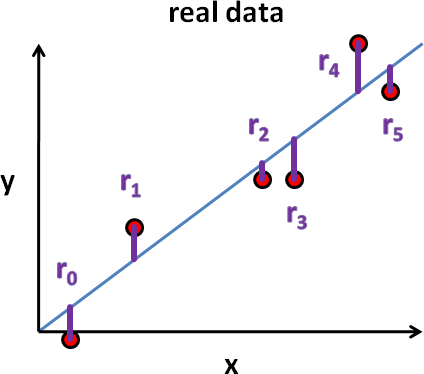
The differences are called the residual errors.
Suppose we fit some line to the data and calculated the
vertical difference between the line and each data point. For
perfect data, these differences would all be zero. For real
data, these differences are not zero, and are a measure of
the goodness-of-fit between the line and data points.
The differences are called the residual errors.
In the figure on the left, the residual errors are
labelled r0,
r1, r2, r3, r4,
r5.
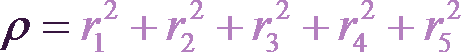
Sum of Squared Residual Errors
The residual errors can be combined in a mathematical
function to produce a function related to the quality of
the fit of the line to the data. The most commonly used
function is the sum of squared residual errors (Gauss),
which in our example is:
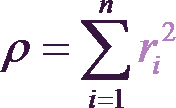
In general, for n data points, the sum of squared
residual errors is:
Minimize the Sum of Squared Residual Errors
 Suppose the fit between a line and the data points is
poor; then the function ρ will have a large value.
Conversely, if the the fit is good, the function
ρ will have a small value.
Suppose the fit between a line and the data points is
poor; then the function ρ will have a large value.
Conversely, if the the fit is good, the function
ρ will have a small value.
The line of best fit is the one that minimizes
the function ρ.
Computing the Line of Best Fit 1
Deriving the line of best fit is not difficult, but
requires a second course in differential calculus or
linear algebra.
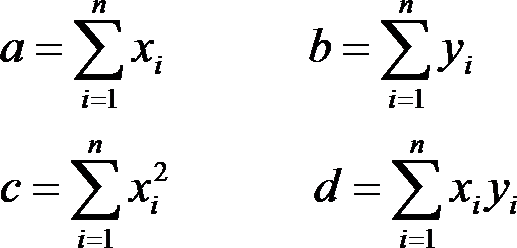
First compute the following four quantities:
Computing the Line of Best Fit 2
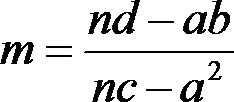
The slope of the best fit line is:
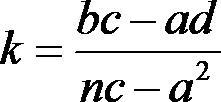
The y-intercept of the best fit line is:
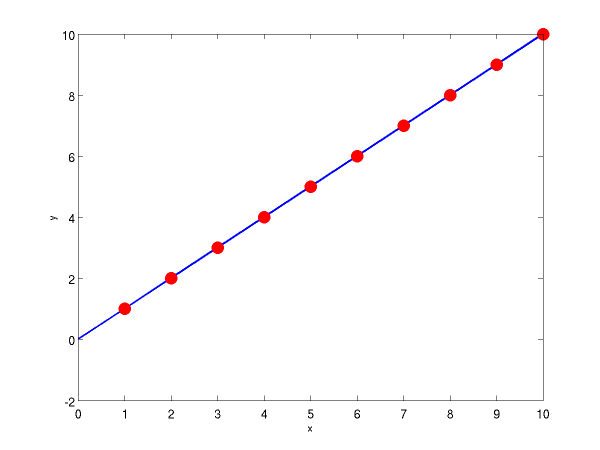
Test Data 1
linedata1.txt contains perfect data from the
line with slope m = 1 and intercept k = 0.
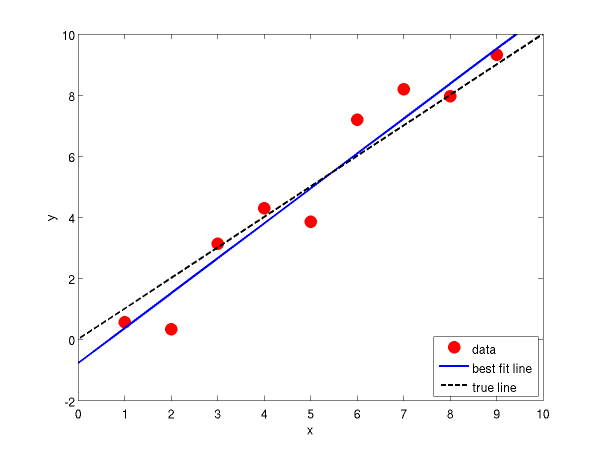
Test Data 2
linedata2.txt contains noisy data from the
line with true slope m = 1 and true intercept k = 0.
MATLAB computes an estimated slope of m = 1.1433 and
estimated intercept of k = -0.7868.
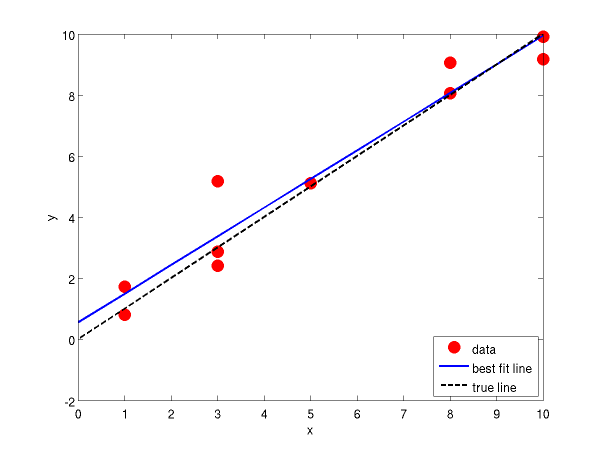
Test Data 3
linedata3.txt contains noisy data from the
line with true slope m = 1 and true intercept k = 0.
There are data points with duplicate values of x.
MATLAB computes an estimated slope of m = 0.9391 and
estimated intercept of k = 0.5477.
Solution Using a Map
linedata1.txt
linedata2.txt
linedata3.txt
Because a Map is used to store the x and y coordinates, this
solution does not allow for duplicated x coordinates; thus, you
will get a different answer if you run this program using
linedata3.txt as input.
import java.io.*;
import java.util.*;

public class LineFit
{
   public static void main(String[] args)
   {
      PrintStream output = System.out;
      Scanner input = new Scanner(System.in);

      // get the file name
      output.print("Name of data file: ");
      String fileName = input.next();
      output.println();

      Map<Double, Double> data = new HashMap<Double, Double>();
      try
      {
         // read the data points into the map
         Scanner fileInput = new Scanner(new File(fileName));
         while (fileInput.hasNext())
         {
            double x = Double.parseDouble(fileInput.next());
            double y = Double.parseDouble(fileInput.next());
            data.put(x, y);
         }

         // must be at least 2 points
         if (data.size() < 2)
         {
            throw new IllegalArgumentException("Not enough data points");
         }

         // compute a, b, c, d
         double a = 0.0;
         double b = 0.0;
         double c = 0.0;
         double d = 0.0;
         for (Double x : data.keySet())
         {
            double y = data.get(x);
            a += x;
            b += y;
            c += x * x;
            d += x * y;
         }

         // compute slope m
         int n = data.size();
         double m = (n * d - a * b) / (n * c - a * a);

         // compute slope
         double k = (b * c - a * d) / (n * c - a * a);

         // output
         output.println("line of best fit:");
         output.println("m = " + m);
         output.println("k = " + k);
      }
      catch (FileNotFoundException ex)
      {
         output.printf("File named %s not found.%n", fileName);
      }
      catch (NumberFormatException ex)
      {
         output.println("Non-numeric data.");
      }
   }
}
Solution Using 2 Lists
This approach uses two Lists to store the x and y
coordinates which allows for duplicated x coordinates; thus, you
will get the Matlab answer if you run this program using
linedata3.txt as input.
import java.io.*;
import java.util.*;

public class LineFitList
{
   public static void main(String[] args)
   {
      PrintStream output = System.out;
      Scanner input = new Scanner(System.in);

      // get the file name
      output.print("Name of data file: ");
      String fileName = input.next();
      output.println();

      List<Double> xData = new ArrayList<Double>();
      List<Double> yData = new ArrayList<Double>();

      try
      {
         // read the data points into the map
         Scanner fileInput = new Scanner(new File(fileName));
         while (fileInput.hasNext())
         {
            double x = Double.parseDouble(fileInput.next());
            double y = Double.parseDouble(fileInput.next());
            xData.add(x);
            yData.add(y);
         }

         // must be at least 2 points
         if (xData.size() < 2)
         {
            throw new IllegalArgumentException("Not enough data points");
         }

         // compute a, b, c, d
         double a = 0.0;
         double b = 0.0;
         double c = 0.0;
         double d = 0.0;
         Iterator<Double> xIter = xData.iterator();
         Iterator<Double> yIter = yData.iterator();
         for (; xIter.hasNext();)
         {
            double x = xIter.next();
            double y = yIter.next();
            a += x;
            b += y;
            c += x * x;
            d += x * y;
         }

         // compute slope m
         int n = xData.size();
         double m = (n * d - a * b) / (n * c - a * a);

         // compute slope
         double k = (b * c - a * d) / (n * c - a * a);

         // output
         output.println("line of best fit:");
         output.println("m = " + m);
         output.println("k = " + k);
      }
      catch (FileNotFoundException ex)
      {
         output.printf("File named %s not found.%n", fileName);
      }
      catch (NumberFormatException ex)
      {
         output.println("Non-numeric data.");
      }
   }
}


