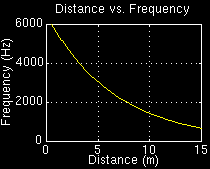
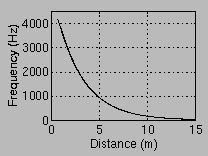
A distance reading obtained from the LRF is mapped to the corresponding set of samples (representing a cosine wave of a specific frequency) and output. There were several different distance-to-frequency mappings experimented with. With each mapping frequency varies inversely with distance (allowing the frequency to increase as the distance decreases), since the higher frequencies can better "grab" the attention of the user signaling an object close-by. The maximum frequency used in all the mappings is 6000Hz. Frequencies above this level, using the present equipment, results in poor sound quality. Moreover, human perception of higher frequencies steadily deteriorates after age 30 and it has been estimated that 65% of visually impaired and partially sighted people are over 70 years of age (Lacey, 1997). In addition to varying the frequency with distance, the user may choose to alter the magnitude of the wave inversely with distance, giving an additional cue to object location.
SAMPLE RATE:
A sampling rate of 22050Hz was used. Using a higher sampling rate (including the CD quality rate of 44100Hz), does not improve the sound quality. However, decreasing the sampling rate does decrease the quality of the higher frequencies (those above 4200Hz). According to the Nyquist Theorem, the sampling rate must be twice the highest frequency output (Hioki 1990). Therefore, the sampling rate was limited to at least 12000Hz. Another consideration to limiting the sampling frequency is memory space. Higher sampling rates require a greater number of samples. However, insufficient memory space has not been a problem, whether generating samples in real-time (in which 4000 samples at 2 bytes each is used at any time), or using a sample look-up table (where 145 waves of 4000 samples at 2 bytes each are stored in the table).
AUDIO ENCODING AND SAMPLING PRECISION:
The audio samples were represented using 16-bit Linear Pulse Code Modulation (PCM (either 8 or 16-bit is allowed with PCM). PCM is an uncompressed audio format in which sample values are directly proportional to audio signal voltages. According to the Sun Microcomputer Systems manual, each sample is a 2's complement number that represents a positive or negative amplitude (Sun Microcomputer Systems manual pages - 'audio').
LOGARITHMIC MAPPING:
The following mapping is used to allow for a perceived change in frequency throughout the entire distance range, and to allow frequency to change on a logarithmic scale:
 Subtracting
the minimum distance from each distance reading to obtain the exponent
enables the maximum frequency to be used as the frequency constant. The
exponent is then multiplied by a constant 'a', to increase the overall
frequency for each reading. For example, without this constant, a distance
reading of 10.00m would result in a non-audible frequency of 0.45Hz, whereas
using the constant a = 0.15 results in a frequency of 1443.05Hz. Both constants
'c' and 'a' were arbitrarily chosen.
PIANO KEYBOARD FREQUENCIES
 The
Sonic PathfinderTM
is an ultrasonic travel aid for the visually impaired, with a maximum range
of 8ft divided into eight one-foot sections. The output consists of the
eight notes of the major musical scale (Heyes
1984). Since most people are familiar with the notes of the musical
scale (Heyes, 1980),
a practical application of mapping the distance readings to the 88 keys
(52 white keys and 36 black keys) of the piano keyboard was considered.
The frequencies of the piano keyboard range from 27.50Hz to 4186Hz. This
follows the scale of equal temperament in which every octave (a 2:1 change
in frequency), is divided into 12 equal intervals allowing for the frequency
of adjacent notes to differ by a factor of 1.05946 (twelfth root of two).
In order to use this mapping, the frequencies corresponding to the piano
keyboard are stored in a table and mapped linearly to distance. Upon obtaining
a distance reading, the corresponding frequency was looked-up, the samples
were generated and output, (samples were created in real-time).
The
Sonic PathfinderTM
is an ultrasonic travel aid for the visually impaired, with a maximum range
of 8ft divided into eight one-foot sections. The output consists of the
eight notes of the major musical scale (Heyes
1984). Since most people are familiar with the notes of the musical
scale (Heyes, 1980),
a practical application of mapping the distance readings to the 88 keys
(52 white keys and 36 black keys) of the piano keyboard was considered.
The frequencies of the piano keyboard range from 27.50Hz to 4186Hz. This
follows the scale of equal temperament in which every octave (a 2:1 change
in frequency), is divided into 12 equal intervals allowing for the frequency
of adjacent notes to differ by a factor of 1.05946 (twelfth root of two).
In order to use this mapping, the frequencies corresponding to the piano
keyboard are stored in a table and mapped linearly to distance. Upon obtaining
a distance reading, the corresponding frequency was looked-up, the samples
were generated and output, (samples were created in real-time).
DISTANCE TO MAGNITUDE MAPPING

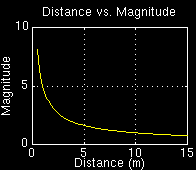
In addition to altering the frequency with distance, altering the magnitude of the wave inversely with distance was attempted, allowing the tones corresponding to short distances to sound louder. A magnitude mapping was included as an option. As with the frequency to distance mapping, several different mappings were tried. and it was decided to use the following formula to allow the mapping to follow the curve above:
The output of pure tones output appear to follow the Fletcher-Munson"curve of equal loudness for tones of different frequencies" (see below), even when the magnitude of the wave is not altered.

The Fletcher-Munson curve represents the amplitude levels at which single sine tones of different frequencies sound equally loud. For example, in order for a 100Hz tone and a 1000Hz tone to sound equally loud, the amplitude of the lower tone must be boosted by almost 40dB (Dodge, 1985). Although the goal was to alter magnitude inversely with distance, the magnitude of a 3500Hz tone exceeds that of the 6000Hz tone (which represents the closest distance and should also contain the greatest magnitude), and is definitely perceived so. This problem can be overcome if the maximum frequency is limited to about 4000Hz. Frequencies increasing from 20Hz up to 4000Hz are perceived as louder.
GENERATION OF THE SAMPLES
REAL-TIME SAMPLE GENERATION vs. WAVE-TABLE LOOK-UP
The samples corresponding to each cosine wave can be generated immediately upon receiving a distance reading from the LRF (real-time), or the samples can be calculated and stored in a wave look-up-table (a pre-defined number of frequencies will be created), prior to initiating readings from the LRF. In this case, when a reading is obtained, the samples corresponding to it are "looked-up" and output. Using real-time generation allows the mapping of each distance to a unique frequency cosine wave, whereas when using the table of samples, certain distances will respond to the same frequency output. However, the difference between the frequencies decreases as the distances increase, (using the present logarithmic mapping), and since humans require a minimum change of frequency between two pure tones (about 2-5 Hz), to perceive them as different (Hollander, 1994), the real time generation is not essential. Real-time generation is approximated using the look-up-table by increasing the number of frequencies stored in the table. However, increasing the number of frequencies stored causes an increase in both the memory space required, as well as the time to initialise the table. A look-up-table containing samples for 145 cosine waves was used. This table contains waves for distances ranging from MIN_DISTANCE (0.5m) increasing by 0.10m until MAX_DISTANCE (15m). The increment of 0.10m represents the accuracy of the LRF. With the present size table, it takes approximately 8 seconds to initialise. Nevertheless, time is saved using the look-up-table. In particular, it takes approximately 0.091 seconds to obtain a reading, determine and output the corresponding samples whereas using real-time sample generation takes approximately 0.118 seconds. This decrease in operation time allows for an increase in the number of readings taken per second.
DEPTH DISCONTINUITY (DC):
There are many situations where the difference between the present distance reading and the previous distance reading is larger than a pre-defined value. This is defined as a depth discontinuity, or, a sudden change in depth. It is important to convey such information to the user. For example, this could be used to locate a doorway with the door open since the distance to the object beyond the doorway (a wall etc.) will generally constitute a depth discontinuity. Distance changes greater than 1.50m will result in a depth discontinuity. It was found that using a value greater than this will prevent several instances where there is a depth discontinuity from being conveyed to the user. For example, by measuring the distance between several doorways and the wall beyond, there were several instances where the depth discontinuity is quite small (e.g. less than 2.0m). To convey a depth discontinuity to the user, a signal different from any of the pure tones used for regular output was used (pulse signal), ensuring that a depth discontinuity corresponded to a unique signal. to create the samples representing a pulse, values representing PCM encoding (-32768 to 32767), were assigned directly to the samples in the following manner:
![]()